During this project, we analyzed data on yellow taxi movements in Manhattan from 2022 to 2024. We presented a report to a bus company interested in investing in an electric vehicle fleet, detailing the most profitable areas, days, and times for deployment based on historical data. We also provided market trend predictions using Machine Learning models and offered a recommendation system for selecting the best electric vehicles approved for taxi use in New York City.
This project was developed primarily in Spanish, which means that several components of the development, including the dashboard, may be in Spanish
At DataLogic, we conduct data science work to help companies transition to sustainable and environmentally friendly strategies. Using advanced analytics and predictive models, we provide solutions that optimize operational efficiency and promote environmental innovation through the development of business tools that, in addition to the above, increase company profits.
TEAM
Juan Carlos Garzón Rodríguez | José Santos Iparraguirre Mancino | Mateo Tagliaferro | Pol Dajer (Paula Daher) | Jesus Felipe Sepulveda Alvarez
TEAM
Juan Carlos Garzón Rodríguez | José Santos Iparraguirre Mancino | Mateo Tagliaferro | Pol Dajer (Paula Daher) | Jesus Felipe Sepulveda Alvarez
↓ Tech stack
OBJECTIVES
The project includes four key components:
📊 1- Analysis Dashboard: Visualizes and analyzes historical taxi movement data in New York City, helping users understand past trends.
📊 1- Analysis Dashboard: Visualizes and analyzes historical taxi movement data in New York City, helping users understand past trends.


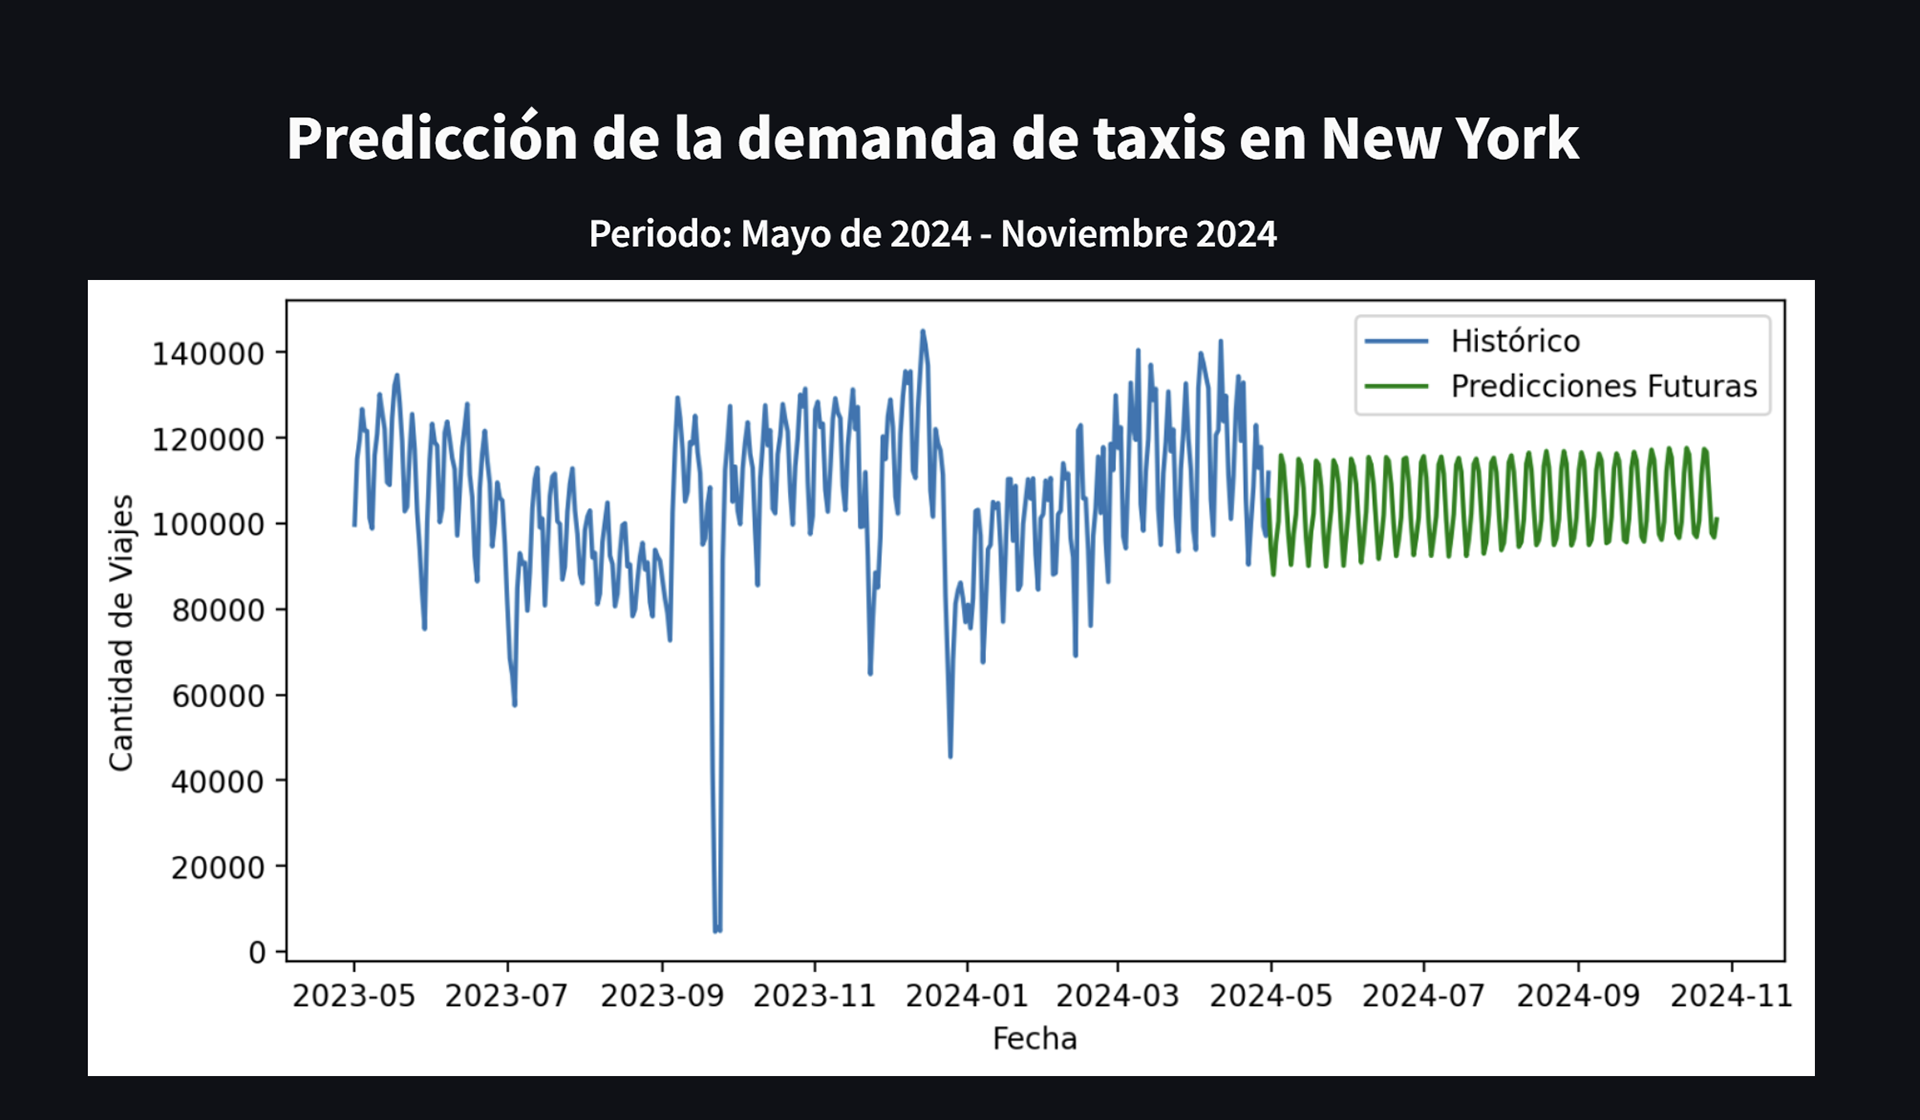
🔮 2- Future Movement Prediction Model: Uses machine learning to forecast future taxi movements, aiding in anticipation of demand and supply dynamics.
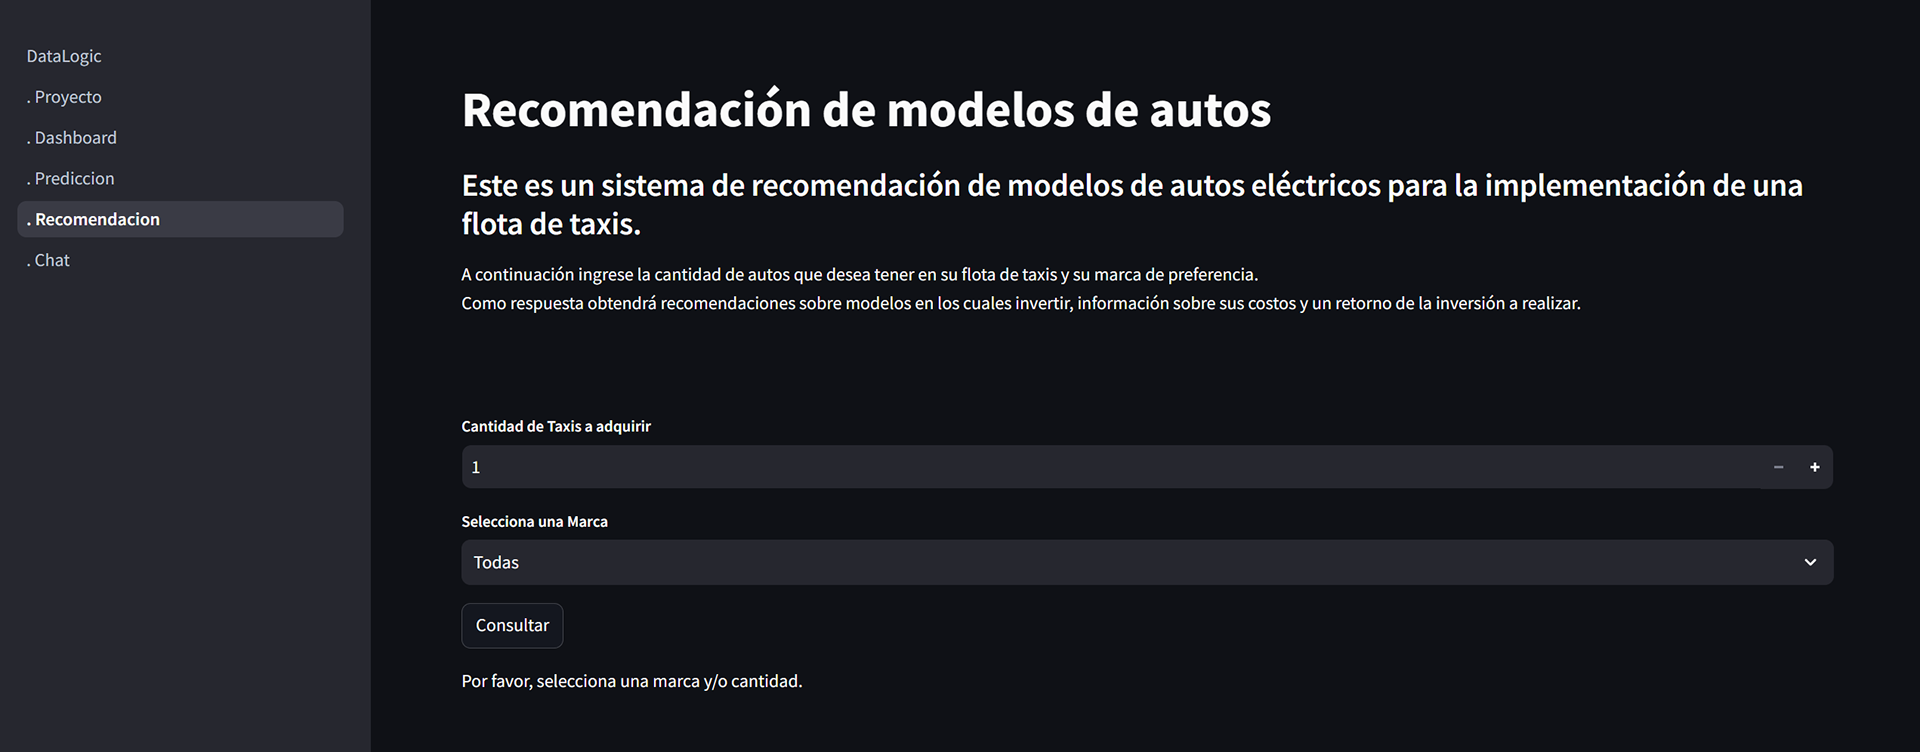
📈 3- Fleet Investment Recommendation System: Suggests optimal vehicles for fleet investment based on business needs and desired ROI.
🤖 4- Technical Specification Chatbot: An AI chatbot that offers detailed information on vehicle models through an interactive chat interface, facilitating informed investment choices.The DataLogic NY Taxis project aims to provide potential investors with a robust analytical framework

DATA FLOW
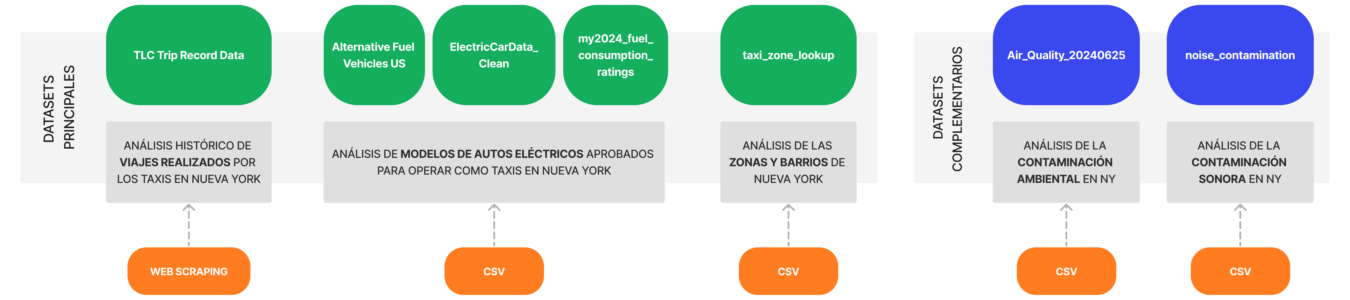
⛏️ Data Extraction: We extracted data from the sources described above. In this project, we performed web scraping on the official website of the New York City Taxi and Limousine Commission to collect Parquet files with historical data on yellow taxi trips for the period 2022-2024. We supplemented our dataset with information on electric vehicles, including their range, efficiency, and operational costs.
🔍 EDA (Exploratory Data Analysis): During the Exploratory Data Analysis, we loaded and validated the data to perform a statistical summary, identify null values, and visualize the distributions of key variables. We analyzed annual temporal patterns and correlations between variables to evaluate relationships, such as the possible influence of CO levels and decibel levels on taxi usage. Anomalies in the data were also identified to ensure its quality.
🧹 Data Transformation and Cleaning: In the data transformation and cleaning process for this project, key actions were taken to prepare the datasets. Date formats were corrected, null values were handled by removing rows or imputing values, and outliers that could affect the analysis were identified and addressed. Additionally, new derived variables were created, and numerical data was normalized to maintain consistency and prepare for further analysis. Irrelevant columns were removed to focus on the most pertinent data, ensuring data quality and coherence.
📥 Data Ingestion: The preprocessed data and the data obtained through web scraping, including taxi trips, zone, and service data, as well as air and noise pollution data, were stored in Cloud Storage as raw files.
⚙️ Data Processing: Automated pipelines were executed using Cloud Functions to clean and transform the data in Cloud Storage. This process included data validation, error correction and formatting, as well as the removal of redundant or incomplete data.💾 Storage and Analysis: The cleaned and processed data were loaded into BigQuery, where they were available for complex analysis and SQL queries. BigQuery provided the scalability needed to handle large data volumes and high-performance queries.
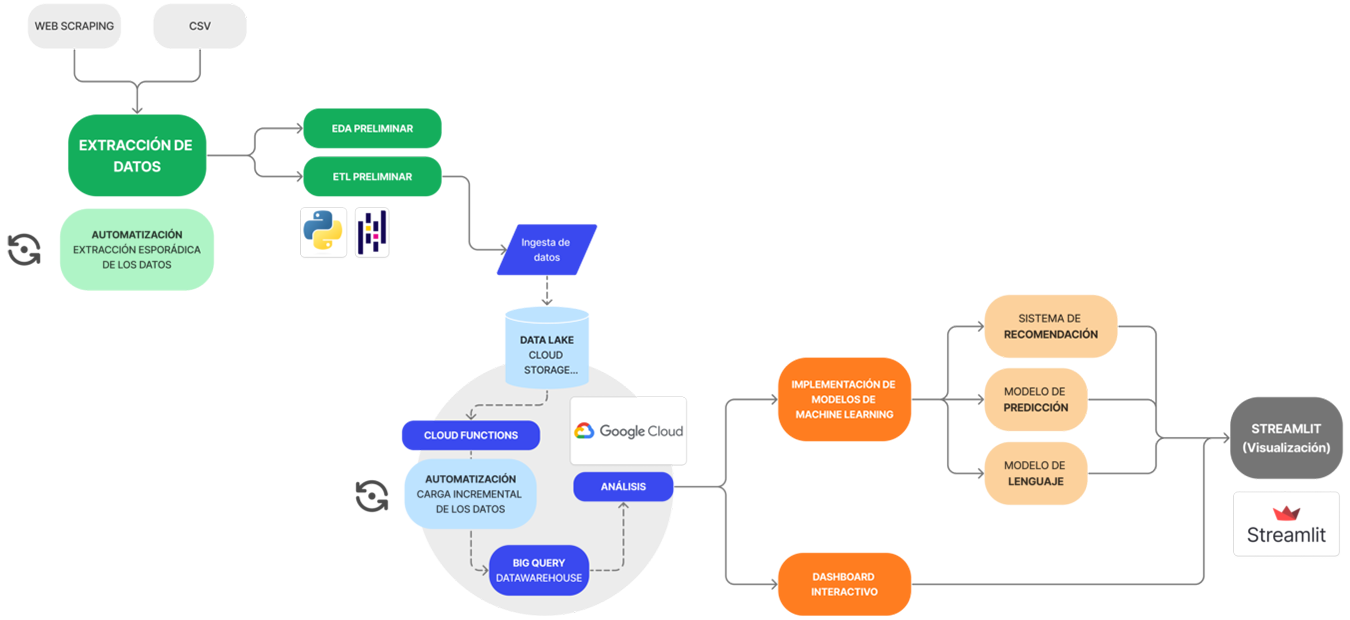
📈 Visualization and Reporting: Power BI was directly connected to BigQuery to create interactive dashboards and visual reports. This allowed stakeholders to intuitively explore and analyze the data, identify trends, and make informed decisions based on the analysis results.
🔑 Key performance indicator:
KPI #1 Total Number of Trips: increase the total number of trips by 15% compared to the previous semester.
KPI #2 Taxi Fleet: add one vehicle to the electric taxi fleet each year.
A new vehicle could be added to the electric taxi fleet every 12 months by reinvesting 15% of the revenue into acquiring new operational vehicles.
KPI #3 Income Variability: increase annual income by 5% compared to the previous year.
🤖 Machine Learning: We developed Machine Learning models to predict future demand for taxi trips, a recommendation system for investing in different electric vehicles, and a chatbot to answer questions about them.
🎨 Streamlit: The final products were embedded in our app developed with Streamlit, providing all the information the client needs in one place.
🎨 Streamlit: The final products were embedded in our app developed with Streamlit, providing all the information the client needs in one place.