The Mobility and Road Safety Observatory (OMSV), a research center under the Government of the Buenos Aires City, concerned about its very high traffic accident mortality rates, commissioned me to conduct a data analysis project on its traffic accident database for the period from 2016 to 2021. The goal was to decipher trends and patterns, understand vehicular behavior in the city, and make informed decisions.
As the analyst, I carried out the following tasks:
- Data Cleaning and Preparation: normalize and transform the data to make it compatible and consistent. ETL process
- Data Analysis: apply statistical techniques and algorithms to explore and understand the data.
- Identify patterns, trends, and relationships within the data.
- Data Visualization: create a dashboard with graphs, tables, and other types of visualizations to represent the data in a comprehensible manner.
- Conclusions: interpret the results of the analysis and drew conclusions to help stakeholders make informed decisions.
↓ Tech stack

Exploratory Data Analysis:
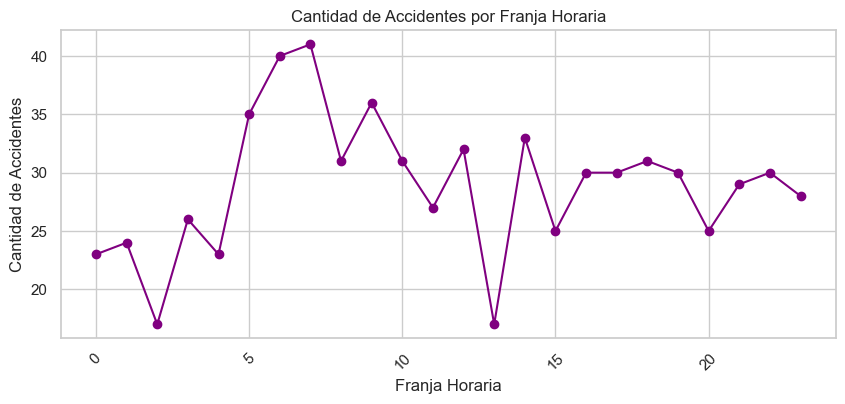
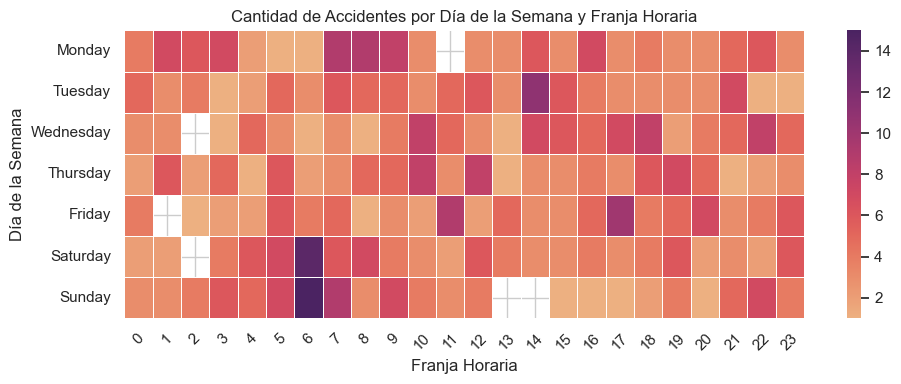
I conducted an exploratory analysis of the data to better understand the relationships between variables, detect behavior and interesting patterns that could inform future decisions. I explored the relation between: ACCIDENTS AND TIME, ACCIDENTS AND NEIGHBORHOODS, and ACCIDENTS, VICTIMS, AND ACCUSED. I created coherent graphs according to the type of variable, which provided valuable information to understand behaviors.


Dashboard Design and Creation:
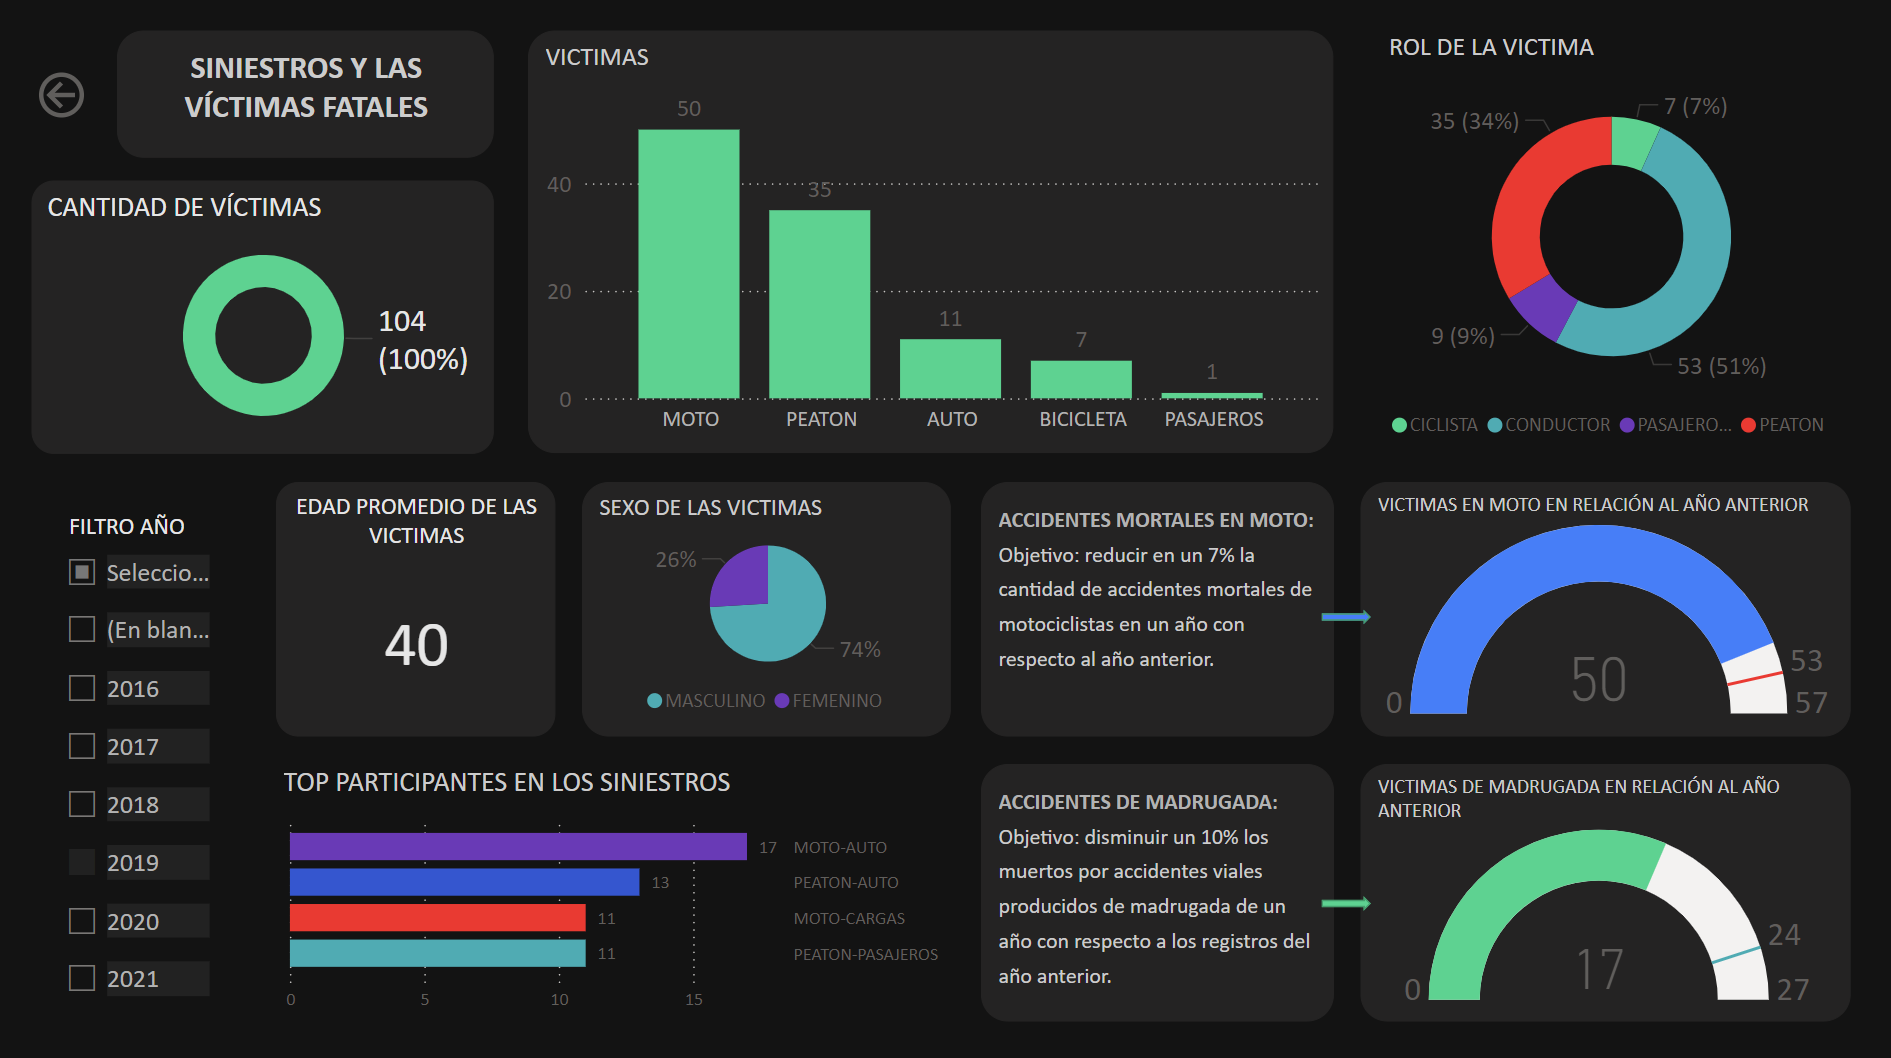
I created an interactive dashboard in PowerBi showing all the analysis conducted through relevant and coherent graphs to facilitate data interpretation. It includes:
- Filters allowing detailed exploration of the data by selecting each one
- Tooltips to complement the information
- KPI analysis
- Various tabs enabling navigation through the three sections detailed above.
- Filters allowing detailed exploration of the data by selecting each one
- Tooltips to complement the information
- KPI analysis
- Various tabs enabling navigation through the three sections detailed above.
KPI Development:
One of the challenges posed in the project was measuring two KPIs established by the City of Buenos Aires to accurately assess whether the objectives were achieved. The two proposed KPIs were:
1. Reduce the traffic accident homicide rate by 10% in the last six months in CABA compared to the homicide rate in the previous semester.
2. Reduce the number of fatal motorcycle accidents by 7% in the last year in CABA compared to the previous year.
I also added a KPI that I proposed, which is necessary to calculate in order to continue analyzing accidents during early morning hours:
3. Reduce the number of fatal accidents occurring during early morning hours by 10% in the last year compared to the previous year. We can observe that the objective set for KPI 2 was not met in 2021, unlike KPI 3, which was achieved as the number of early morning accidents was reduced by more than 10% in 2021.
CONCLUSIONS
Through this exploratory data analysis, I have observed how fatal accident records behave in the City of Buenos Aires.
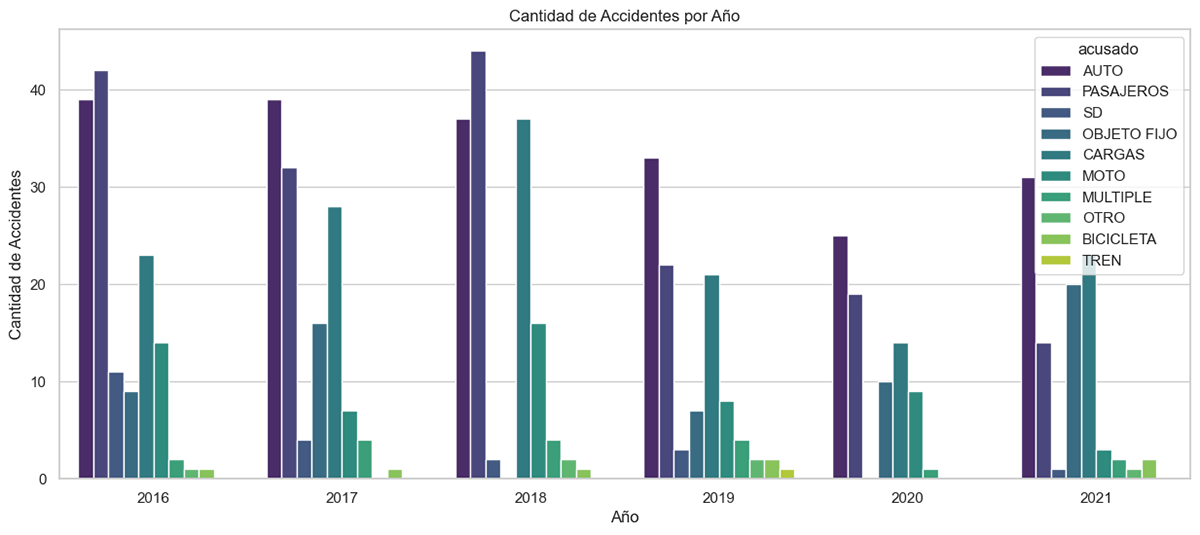
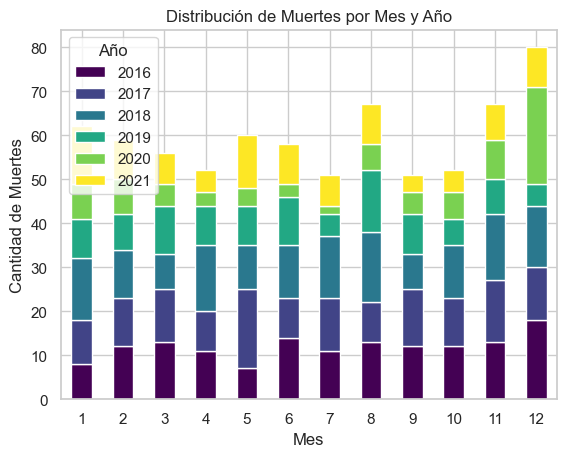
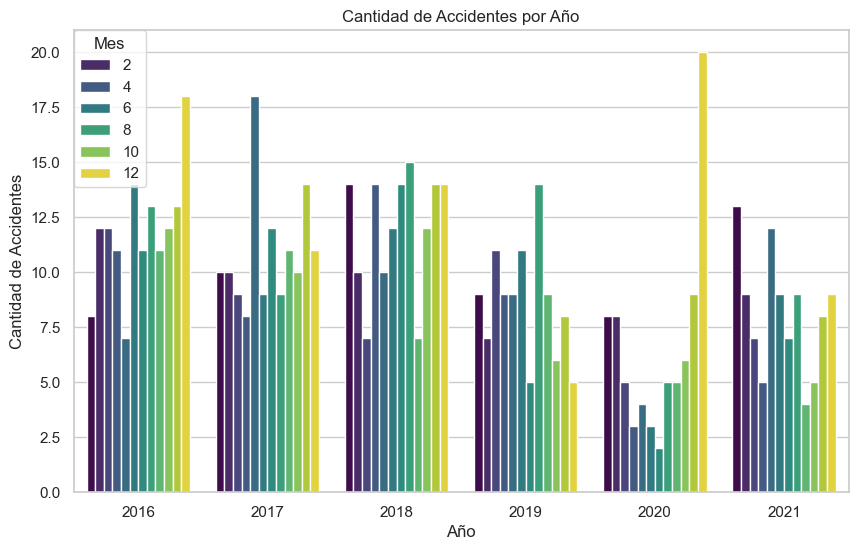
- I can conclude that the months with the highest number of accidents are the festive months when the population is more active and there are more activities in the city. However, traffic accident fatalities occur throughout the year, indicating a need for urgent measures to reduce this rate. It is also noted that the number of fatal accidents in 2020 dropped sharply due to the lockdown.
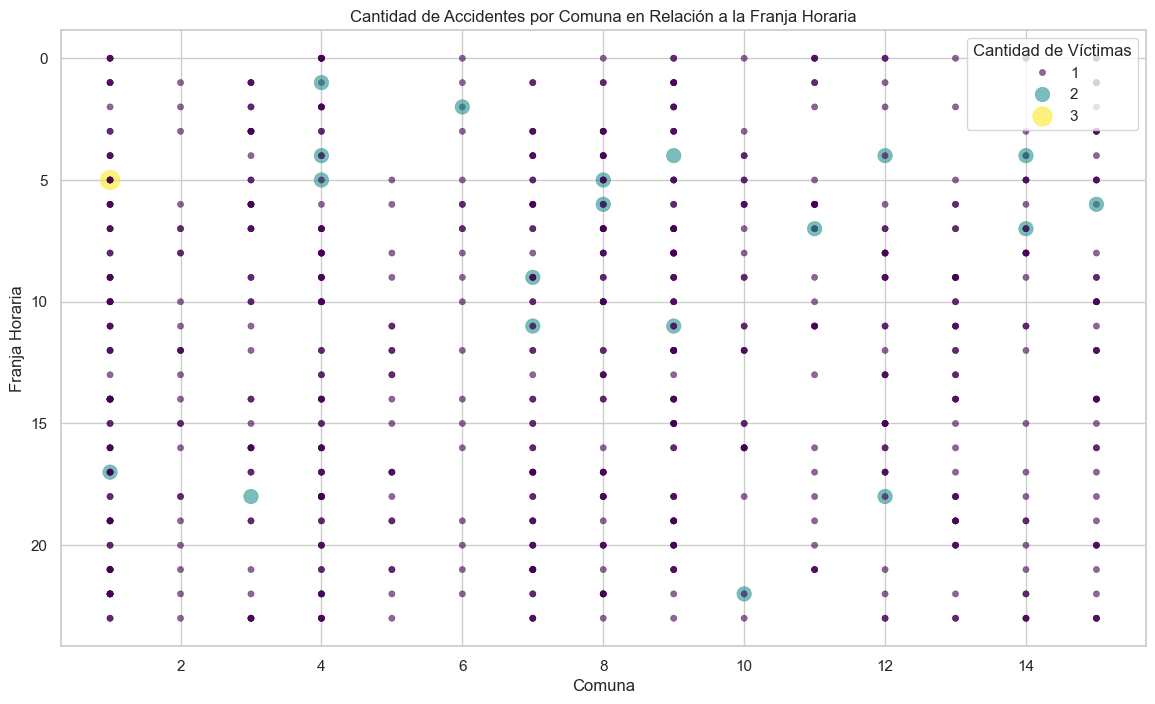
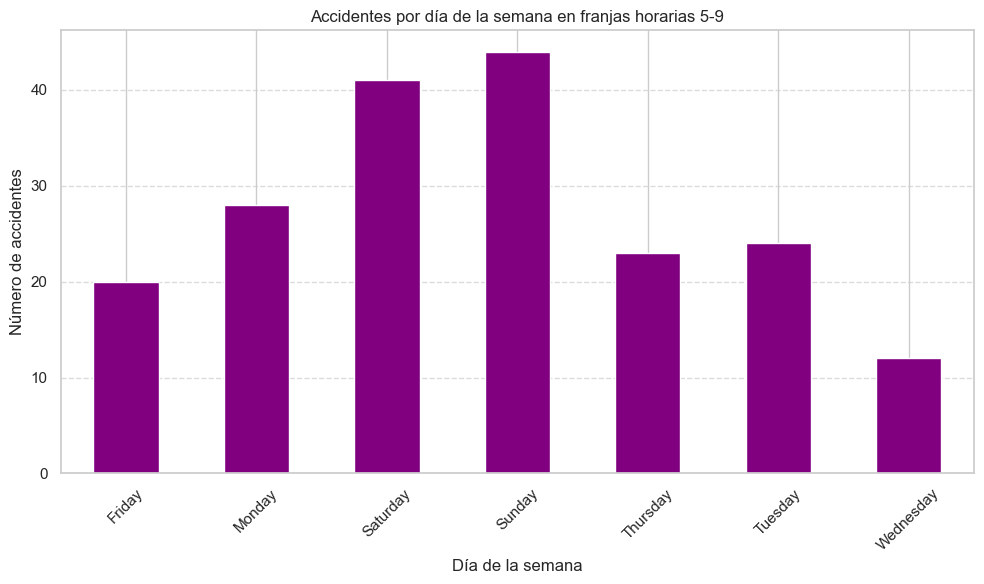
- By cross-referencing metrics, I observed a significant concentration of fatal accidents on weekends during early morning hours in specific neighborhoods, which have a higher density of bars and nightlife venues. This calls for urgent measures regarding alcohol testing.
- Most accidents occur on avenues in these neighborhoods, and it is observed that the majority of accidents are caused by cars.
- Regarding fatal victims, it is observed that most are male, aged between 20 and 40 years. There is also a very high record of pedestrian fatalities, which calls for measures to increase driver awareness and respect for pedestrians